Making Every Drop Count: Sourcing Water-Conscious Barley for Sustainable Beer
July 23, 2019
sustainabilitysupply chain

Agros® Volatility Index forecasts historic yield, market values, and revenue potential at the field level to assess investment risk for agricultural lending institutions across the globe.

by Jim O'Brien
August 13, 2019
This year trying to calculate farm level gross revenue is anyone’s guess. With an unknown acreage of prevented planting claims, unpredictable global tariffs, rising commodity prices, and uncertain production, this season is shaping up to be a highly unusual year across the Midwest.
This uncertainty impacts more than just farmers. It is also passed onto those banking institutions who provide operating capital to growers and landowners. For many banks, this year has exposed high-risk accumulations across a large geographic area and a historic level of Chapter 12 bankruptcies for the agricultural industry led to more acres being shifted under fewer, larger farms. To navigate wisely, these agricultural institutions must explore new ways to understand market prices and grower risk. Many are turning to cutting edge technology to help them.
What Zillow did for real estate, Agrograph does for agriculture by creating data for the entire population. Zillow’s pricing model doesn’t just create a value for a singular home, but a snapshot of prices for every home in a neighborhood. Similarly, Agrograph’s model creates a yield value for every field in a county, a big picture snapshot to guide important decisions.
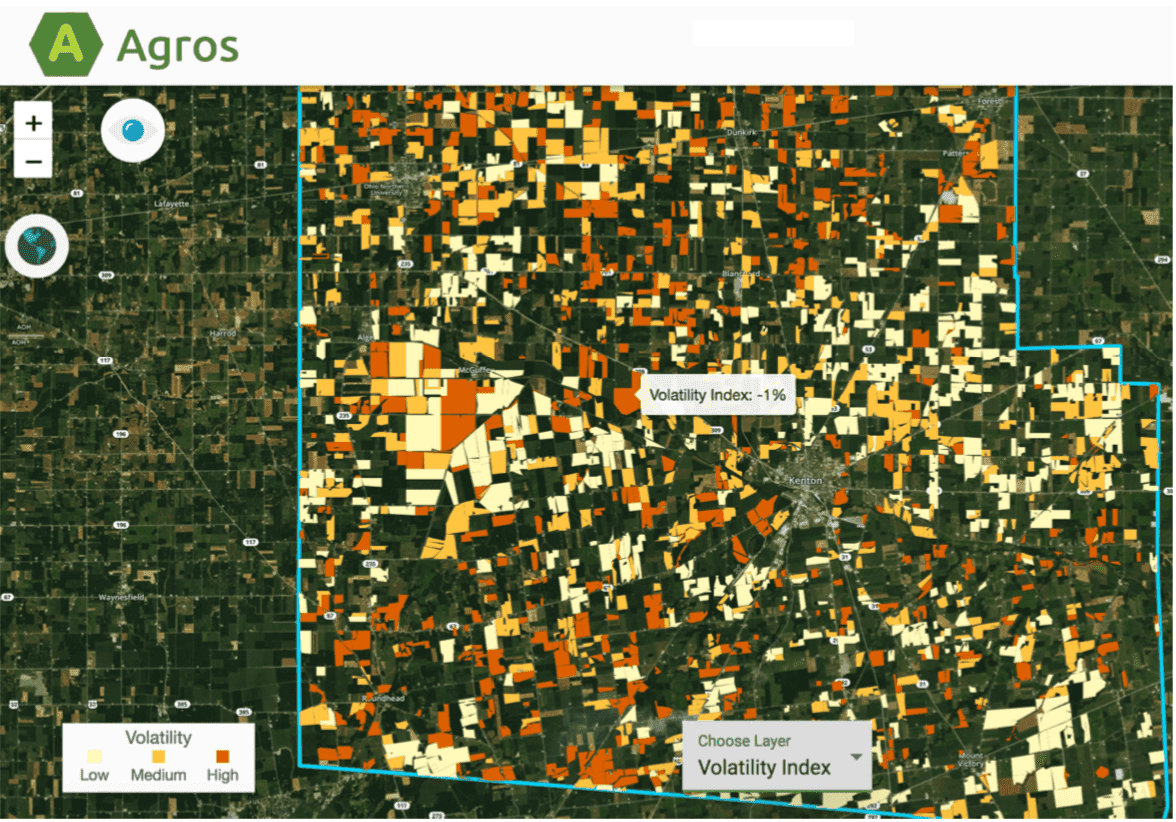
Agros® Volatility Index for every field in Hardin County Ohio for 2018.
Agrograph works with several major agriculture lenders to assist with farm-loan portfolio management. Its Volatility Index compares risk across a financial company’s loan portfolio, providing insight into customer fields. Combining this index with Agrograph’s gross revenue tool allows lenders to forecast potential losses for high-risk and emergent loans throughout the growing season rather than retrospectively at the end of the season.
The Agros model assigns a crop type and yield value to fields while identifying underperformance or overperformance based on geographic benchmarks. Agros assigns a production value to each parcel of land -- data that is critical for risk appraisal models utilized by ag lenders. The same Agros® technology can also be applied to indicate the maximum earning potential for a piece of ground. Agrograph accesses a 10 year yield history of a field and compares that information against real-time pricing information from the Chicago Board of Trade. As a result, lenders calculate whether a field is producing at its peak or underperforming compared to historical benchmarks. This type of granular insight gives an ag lender a window into the management score for a particular grower -- information that cannot be obtained just from a financial analysis of their books.
Larger farm size increases demand for capital across the industry. The U.S. Department of Agriculture reports operating expenses grew 22 percent in the fourth quarter of 2018 - the highest fourth-quarter level in history. The agency also found farm debt projections rose nationally to $426.7 billion, depicting an unstable landscape for agriculture. These conditions may trigger a huge volume of non-accruing loans or, most likely, a larger than normal volume of loan readjustments for institutions managing high-risk portfolios.
Risk management tells lenders to shy away from the volatile conditions in agriculture given the unstable landscape. That means less loan availability for farmers. Despite this logic, lenders in niche agricultural-markets will continue to invest in the industry.
Jim O'Brien has been helping corporations navigate innovation initiatives & build sustainable processes for over a decade. He is Co-Founder and CEO at Agrograph. Connect with him on LinkedIn.
article
July 23, 2019
article
September 23, 2019
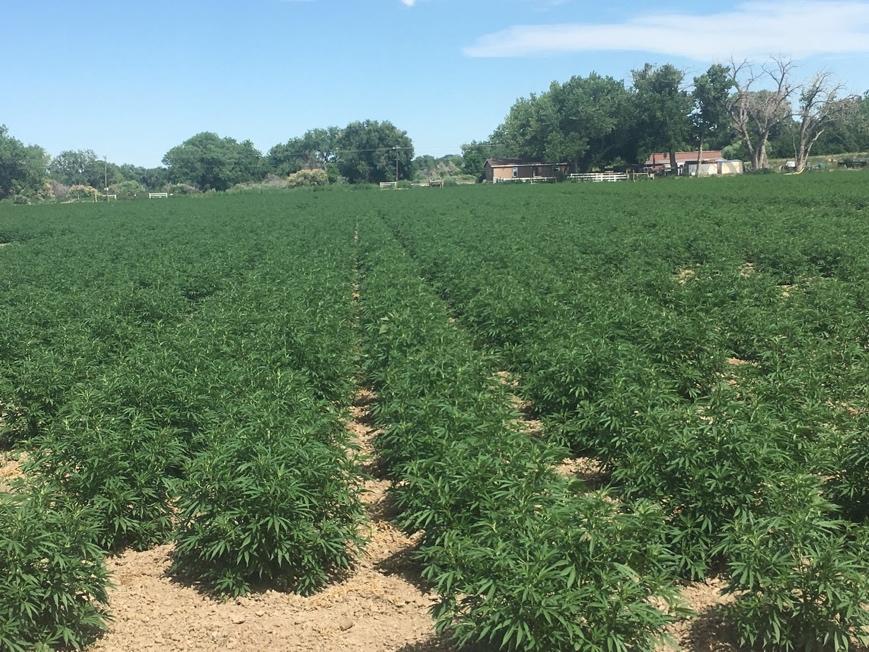
Agrograph’s granular data provides key supply-side insights to stakeholders in the industrial hemp industry.